Category Archives: Analytics

25 Very Important Questions to Ask Yourself Before Going Live With a New Construction Business Website

This is a helpful list of questions (in no particular order) you, the construction marketer, may want to ask yourself just before hitting that “go live” button for your newly re-designed website.

There is a FREE downloadable document at the end of the post to give you some guidance and advice on each of the questions and what you need to do or check to ensure you launch your construction business website in the best possible way.

It’s your responsibility as a marketer to ensure all the necessary tasks, elements and checks are in place to improve performance of your website from the word go. Continue reading

Spam Events and Keywords in Google Analytics

Today I have just noticed that the below event in your Google Analytics event tracking reports is actually spam.

event tracking spam

I did actually notice it a few days ago on another clients profile but it just so happens that there was some event tracking integration going on at the same time – so i just put it down to user error (developer not following instructions).

Continue reading

Compare Your Google Analytics Data with Other Construction Websites

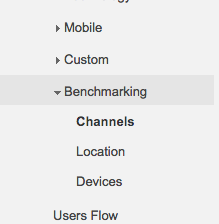
Google Analytics recently announced they are bringing back Benchmarking reports for all Google Analytics users. If you login to your account you should see “Benchmarking” within the Audience category of reports as shown below. google analytics benchmarking data I’ve just spotted the reports appearing in my accounts as of today and here’s a quick glimpse of what data is available to compare. If you don’t see the reports yet in your account then scroll to the bottom for a quick video on how to set it up. Continue reading

A Quick Look at the New Twitter Analytics – Now Open to All

Twitter announced this morning that Twitter Analytics is now open to all users – it was already open to all users but there’s been a complete revamp in the data available.

Here’s a quick look around:

Overall tweet performance and monthly comparison:

Useful to see if this months activity has generated more impressions than previous month – but remember this needs to be put into context or viewed alongside other metrics such as clicks, retweets and favourites. Continue reading

Experimenting with EmbeddedAnalytics to create Google Analytics Dashboards

I was recently contacted by Mark Schenkel of Embedded Analytics to try out a piece of software he’s created which allows you to quickly create and embed your Google Analytics data right into a web page.

No more learning how the Google Analytics API works and no more remembering all those dimensions and metrics.

I’m normally accustomed to using the Google Analytics API with Google Spreadsheets and some scripts to fetch the data, run the queries and then turn it into visualisations such as graphs, line charts, pie charts and maps so this was a no brainer for me as I knew it could save me some time doing a lot of the manual work. Continue reading

A Quick Look At Content Grouping in Google Analytics for B2B Websites

Content grouping in Google Analytics is a wonderful new feature which I have been playing around with for a few weeks now.

Basically, the content grouping feature allows you to group a set of URL’s or pages so that you can view aggregated data such as visits and conversions by category or by sections of your website.

For those who need an intro, here’s a video which explains what it is and how it works:

Continue reading

Must Have Widgets on Every Construction Marketers Google Analytics Dashboard

Quite often, Google Analytics can be minefield when it comes to extracting data which actually means something to the person looking at it (the marketer).

I’ve heard this phrase so many times “I just don’t know where to start or what to look it”.

Google Analytics dashboards present a very quick and easy way to view just the top level data you need to answer some very simple marketing related questions.

Remember, the purpose of dashboards is to get you, the marketer, to ask better questions. To then be curious and ask “why has this gone up or down?”. That’s where data mining then starts.

So here are my top widgets that every marketer in the construction industry should have on their Google Analytics dashboards: Continue reading