1) Open up Google Analytics and select on CONTENT. Then on the right hand side you will see NAVIGATION SUMMARY.
2) The report will open up and automatically select your homepage title. If it shows no data then click on the drop down box next to ‘Content’ and select your URL for your homepage.
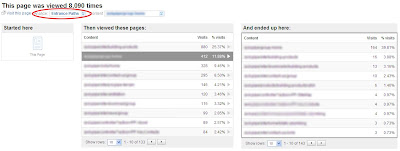
3) You will be presented with something that looks like this (click to make it bigger):
For this example, I have selected my homepage. I can see that 63% of visitors entered my site on the homepage. 37% of visitors came to my homepage from a previous page. What this means is that a visitor who has landed deep within your site, such as a landing page, may have clicked on HOME within the navigation bar or breadcrumb. So they may have landed on a product page but then gone back to the homepage to see what else your site has to offer.
Ok, so now that we know how many and how they got to my homepage, what about where they went next?
Surprisingly, 2.5% of visitors left the site from my homepage. If this number was over 10% then I would be very worried as this could be telling me that my homepage is not very well organised or user friendly. However, 97.5% of visitors clicked through to another page. The list under the ‘next pages’ is sorted by percentage of clicks.
Nearly 30% of visitors who visit the homepage click through to PAGE A. Wow, nearly a third of my visitors click through to PAGE A. Why is that? Is it a core product/service I have to offer? Is it because we have been conducting vast amounts of print ads pushing this particular product? Dig deeper.
What you can do is start to build a picture of which pages have the largest click percentage over a period of time.
TIP: Check on a monthly basis the click stream from your homepage. Where are they going? How does it compare to last month? Is the number of clicks to a particular page up or down compared to last quarter? Why is that? Is another marketing campaign influencing where most of the click stream goes?
4) Ok, now that you know the distribution of click % for your homepage, what about a top landing page? You may need to visit the ‘Top Landing Page’ report. If you know what your top landing page is then select it from the drop down box as shown below:
5) You will then be shown the same report as previously but just for your TOP LANDING PAGE. (click to make it bigger)
Ok, so here is my top landing page navigation summary. Nearly 70% of visitors entered on this page (primarily from PPC ads) and 30% from another page within the site. I can see which pages they entered from underneath.
TIP: If you get goal pages in your Previous Page list then why is that? Have the downloaded a PDF and then had to go back for more info? Check your navigation on your goal pages?
The great thing is that my landing page is working as only 2.9% of visitors exit from this page. 97.1% of visitors go on to visit another page and again you can view which pages they go onto view. What if 27& of visitors go onto the ‘Contact Us’ page? What if 5% went onto view a completely different product? What if 8% went onto view the ‘About Us’ page? Using the Navigation Summary report you can see what and where your visitors are going. Are they following the path you set out? Where are the deviating? Why are the going off somewhere else?
TIP: Check if your goal pages (i.e. contact us, download or registration pages) are high up on the % click share list. If not why not? Are your call to action buttons not big enough? Are visitors going back instead of forward?
So there you have it. A quick look at Navigation Summary, you can always dig deeper and get more insight into what pages are being viewed after or before a certain page within your website. Are you visitors doing what you want them to do? That is the main question you need to answer and this report will help you understand that.
TIP: Try segmenting your visitors and viewing the report then. Is Organic traffic behaving the same as PPC traffic? How is the traffic from an E-Mail campaign behaving once they get to your site?
Remember, segment, segment and segment again to get the best insights to drive further action.
What about where your visitors start their session and end their session?
Use the ENTRANCE PATH report to show you where visitors started (by selecting a specific page) and then ended up. Are your goal pages where they ended up? Are visitors ending their session on the pages you want them to end on (i.e. goal pages). If not, why not?


