Tweet: How to measure social media success
Tweet: 732 free tools to measure social media
Tweet: How to measure social media success
Tweet: 101 free tools to help your understand social media
Tweet: 11 ways to increase success on Twitter
Does the above sound or look familiar? Is your timeline full of tweets like this?
There are hundreds of free tools out there being tweeted all day, everyday. Tools which allow you to monitor your social media activities but there is no one tool as good as Twitalyzer. It really is ‘serious analytics for the social media expert’. Ok, firstly I am no expert but I do love analytics and social media.
I was introduced to Twitalyzer about 5-6 months ago and I have to say it is the most advanced bit of kit I have come across for measuring performance on Twitter. Notice I say ‘performance’ and not success. By understanding and establishing your key performance indicators you will also find it easier to reach your objectives or goals.
Step back to my ‘732 free tools to measure social media’ tweet example. Slight exaggeration I know. The problem marketers and businesses have today is that there are lots of websites, software and apps out there that will help you measure your performancem, some even claiming to show you success. Its just a bit to confusing if you ask me!
How do you know which tool or tools to use? How many websites will I have to bookmark to get me the data I need? Which metrics do I monitor? Which KPI’s should I use to help me accomplish my objectives?
Look no further.
This is why Twitalyzer is great. Because for me, and for you, everything needed to measure and analyse your business social media performance is in one place. No more needing to keep visiting those 15 websites on a monthly basis to collect all the data and then export into a spreadsheet and run a few calculations. Twitalyzer 2.0 is the complete package!
For this review I am going to try and not go into all the finer details so much but give you an overview of what insights can be drawn from using Twitalyzer if you are a business with a Twitter prescence.
Twitalyzer – Serious Analytics for the Social Media Expert
Twitalyzer, created by Eric T Peterson and Jeff Katz, is a measurement tool for short-media messaging or micro-blogging with Twitter being the dominant platform. Twitalyzer has been created for businesses and not for the casual user and for those where accountability is important. It takes data and puts into meaningful key performance indicators such as Clout, Influence and Impact.
Quick look at the menu options. Every report provides you with insights into how you are performing as a business and whether or not your social media strategy is working for you. Reports are shown as graphs, sometimes interactive, and also as visualisations.
Click on ‘Dashboard’ and you will be presented with a display as below showing the the key metrics and measures along with a quick view graph and a symbol to show you at a glance whether that metric or measure has improved or decreased. Each one provides you with a different picture or area you may or may not need to focus on.The top 5 metrics and measures are the most important to maintain.
Full list of defintions for each metric and measure can be found here.
The ‘Impact’ metric is displayed with a ‘tick’ which means my score has remained unchanged over a 30 day period. Very good. The ‘Impact’ metric is calculated by taking the number of followers, unique references, frequency of uniquely retweeted, uniquely retweeting other tweeters and frequency of updates. Impact is the most important metric as this is the number of people paying attention to you with their measured participation. Everything you do or tweet will have an impact on other metrics and measures, but what is important is that you use the data to guide and improve in areas where needed/required.
My ‘Influence’ and ‘Clout’ are also healthy which means that I am doing well in order to get my business mentioned/referenced and/or retweeted by others. If this decreases you need to ask yourself “Is my content relevant to my followers?” If the content is of poor quality then the less chance it will be retweeted.
My ‘Generosity’ levels have dropped which indicates I need to retweet tweets of relevancy more often. Having said that, it doesn’t mean retweeting everything as this will also have an adverse effect on metrics elsewhere such as ‘Clicks’ or ‘Influence’. You should only retweet something which reflects your social media interest or offering. So if I was a business, why should I retweet something that does not reflect what I do or the personality of my brand?
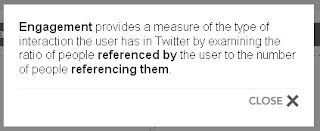
The ‘Engagement’ measure has increased which indicated I am engaging more with other tweeters. If you click on the blue graph you will be presented with a more detailed view over a period of time. Again, businesses should be asking “Why has the level of engagement decreased?” “Why did it increase?” “Who are we engaging with?”
I also like to use ”Hashtags’ within my tweets, hashtags are a great way to join mini communities who have the same interest or topic/subject. This is a good way of increasing the ‘Engagement’ metric and ‘Followers’ measure. Below graph indicates the increase in followers over a 30 day time period.
My ‘Updates’ measure has also decreased which tells me the number of updates posted on Twitter has fallen compared to the last 7 day count. So as a business you should ask yourself “Why has the number of updates fallen or decreased?” Is it because you don’t have enough content to publish? Is it because your business has been focusing efforts elsewhere? Use the data to give you insights into how and what to improve.
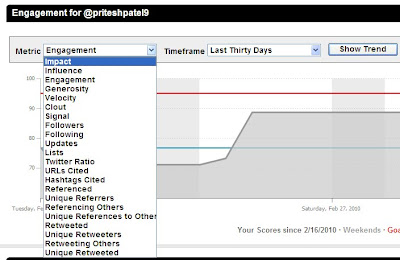
Under each metric you will also have the option to click on ‘Details’ or ‘Define’. Details will give you a closer look at each metric so for this example I have chosen the ‘Engagement’ metric.
The red line represents my Goal which I had set myself and will look at shortly. The blue line is my 30 day average. As you can see my engagement levels at Tuesday 16th of February stood at 76.7%. By Wednesday 24th of February my engagement levels had increased to 88.7%. As a business you should ask yourself “What activities caused my Engagement levels to increase over those particular days?” “Did this have an effect on any of the other metrics or measures?” “Did I make more connections in that week because of activities X,Y and Z?” Again, use the data to help you work out what was successful.
You can view each metric and measure in further detail by selecting the drop down box.
At any date point you can also add ‘notes’. Here you should add notes on every activity which takes place and will have a direct impact on your social media activities and performance? For business users conducting multiple activities this is priceless. Add a note for every activity you implement onto the graph so that you can look back and see which activity caused spikes and which activity caused numbers to decrease.
What notes should I add? Did you publish a blog post? Which you would mark as Good. Did you post a new corporate video which will have an influence on the number of times it gets retweeted (viral)? Did you make an announcement that your site had to close from a few days due to maintenance? In which case you would mark as Bad. This facility is similar to the Annotations feature on Google Analytics and other web analytics tools.
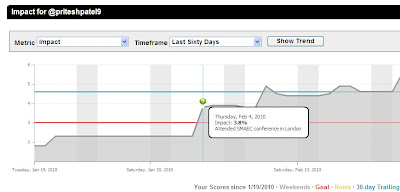
Below is an example of my ‘Impact’ report before and after a Construction Marketing event I attended back in February of this year:
You can see my note (Green symbol) which is my note/reminder that this is when I attended the SMAEC event and since the event my ‘Impact’ has seen a sharp increase. The second peak is when I published my post-event blogpost titled ‘Is the Construction Industry ready for Social Media? No’. Again, my impact increased due to my blogpost. I can also check my web analytics tool to see if the traffic to my blog converted into subscriptions. We can clearly see the impact of a couple of tweets, a blog post over various metrics and measures.
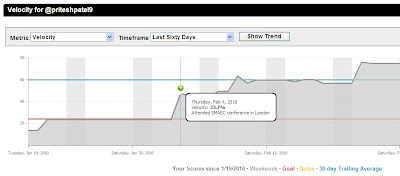
My note also appears on other metric reports too. Screenshot above shows the ‘Velocity’ report and again you can see that after this event my Velocity had increased quite sharply
Twitalyzers definition of Velocity is an indication of the relative frequency at which a user publishes updates in Twitter. Remember the red line? This is my benchmark which I had set in the Goals section of Twitalyzer. Doing pretty well huh?
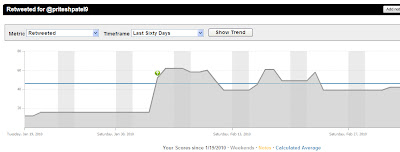
Screenshot below for the ‘Retweeted’ report.
This shows you how often your tweets have been retweeted over a given time period. Many people use ‘Retweets’ as a measure of reach and as the number of retweets increase your reach increases. Is your reach getting you more followers? View the Follower trend screenshot above. Does this have an impact on your ‘Engagement’ now that your following has increased? Again, notice the high levels of retweets during the event and after the event? This was due to the post-event blogpost.
Use each metric and measure to answer business questions. How many new connections did I receive on the back of activity X? Did my web traffic increase because of activity Y and how many led to conversions? By what percentage has my newsletter subscription increased since activity Z or tweets? Ask yourself ‘real’ business questions and mine the data on Twitalyzer and your web analytics tool to get a broader, wider and accurate picture of your social media performance.
It’s important, as with any other analytics tool, that you put the data into context and you use the data to provide you with insights to drive action.
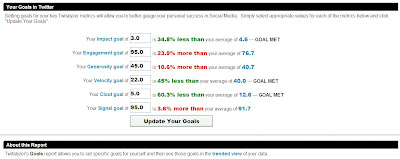
So now that you have a little understanding on how to use the dashboard and the metrics/measures available we can now move on and set us some Goals.
You may need to give yourself some time before you actually set some figures, use your current scores to set benchmarks or targets for you to maintain and achieve. Remember to be realistic when setting your goals! I had set myself an ‘Engagement’ goal of 95% and I am currently at 76.7% which indicates I am still way off my target. I can now set myself a micro-strategy of how I will go about increasing my ‘Engagement’. For example I could join more conversations, using the hashtag to engage with more people and more online communities (#measure community for example)
Most importantly remember to review your Goals on a quarterly or half yearly basis as they may need fine tuning or will indicate where you need to adjust your efforts.
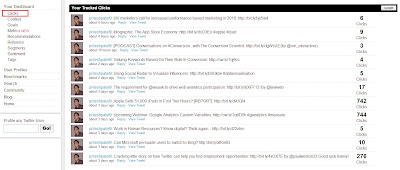
Twitalyzer also counts the number of clicks each of your tweets has received. From a business point of view this is a great measure to view what traffic had been sent to your website or blog from each of your Tweets. Now go back to your web analytics and go see how many of these click turned into conversions of some sort.
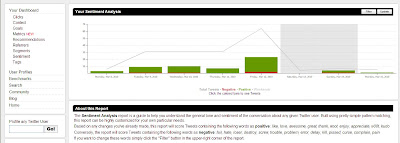
Another important part to Twitalyzer is ‘Sentiment’. The Sentiment Analysis report provides you with the ability to easily track the general tone of conversation for your business. Sentiment is analysed by picking up keywords contained within your tweets. Click on the screenshot below for an explanation of ‘Sentiment’.
Quite simply green means positive and red means negative. Over a period of time have a look to see where and why you have used negative keywords within your tweets. Does this reflect or impact your brand? Are people saying negative things about your business in which case you have had to provide a positive response? Are you involved in positive or negative conversations?
By clicking on the green or red parts of the graph, Twitalyzer will display the negative or positive tweets affecting your ‘Sentiment’ measure. You also have the ability to set or add your own words or filters. Many people use the hashtag #fail to inform others of a negative tweet or review so therefore if you, as a business, tweet #fail or join the hashtag #fail then your negativity will increase accordingly. Ask yourself, do you really want to be saying negative things about others? What kind of persona do you want to build?
My final part of this review is the ability to find out who your top influencers are. These are the people who you engage with regularly, who retweet things you post and act as an indicator of who you should be engaging with more often. You may have 10,000 followers and be following 5000 but how do you know you are connecting with the people who you should really be connecting with? Let this report tell you who you should increase your engagement with. (Sorry if you have been missed off the list…I don’t control it…you do!)
So, I am not going to give the entire game away in this review, but if you are a business heavily involved in Twitter for both marketing, customer service and sales then I really recommend using Twitalyzer to measure your social media performance and success and to help you accomplish your micro and macro goals which form part of your social media strategy.
Remember: Use the data to give you insights to drive action and improve what you are doing.
Twitalyzer has a lot more to offer than just what I have outlined above including Tagging other users, competitors, partners and individuals to benchmark your performance against. Imagine tagging a competitor and comparing their ‘Impact’ to yours? Or even comparing Engagement levels over a period of 30 days? Does your participation and efforts stack up to theirs?
Oh finally, Twitalyzer also integrates with Google Analytics giving you a complete picture from intital tweet through to conversion. Now that can’t be bad can it?
Recommended reads and views: Twitalyzer Blog, Twitalyzer Handbook (PDF), Twitalyzer Help, How to get started in Twitalyzer in 5 minutes (VIDEO), Integrating Google Analytics with Twitalyzer (VIDEO).






What a great post. I’ve been looking at different ways to monitor social media engagement and impact and Twitalyzer looks pretty smart and up for the job.
I particularly like the means to annotate the data with notes – saving the pain of sitting there a month later wondering why the data jumped.
The only draw back as someone monitoring their impact in social media is the limitation of Twitalyzer to the Twitter platform. It would be great if there was a way to expand the analysis over multiple platforms – but I guess that might have to wait for a future release!
From a business perspective, I use Radian6. This enables me to monitor across Twitter, blogs, forums, Facebook fan pages, among others. I find this particularly effective, with monitoring and engagement activities all happening through one dashboard.
Obviously, there is a price with Radian6, but I don’t think it is expense for a business – just a few huundred pounds per month. For personal use though, I can see myself using the free Twitalyzer more and more.
Well done on the post, very useful.
Thank you for this excellent review of Twitalyzer!
Gary: It is true that Radian6 and other similar tools do monitor across a spectrum of social media platforms. However, none really take the deep-dive analytics approach to any specific channel in the way Twitalyzer does with Twitter.
As opposed to other tools out there that are just focused on an individual’s ranking, Twitalyzer is very much geared towards businesses and organizations that are serious about measuring their impact and engagement in Twitter.
We have seen some of the largest global brands, government agencies and small “mom-and-pop” businesses all use Twitalyzer to help improve their usage of Twitter
Hi Jeff
Thanks for the response. To be clear, from the short time I’ve been looking into Twitalyzer, I can already see the value it will provide an individual or business in understanding their impact and engagement on Twitter.
It is perhaps unfair to compare the two products as they both do very different things in social media. I think there is opportunity to use both tools to enhance your understanding.
Hi Gary,
Thanks for the clarification. I think you are 100% on the money about the opportunity to use both tools. They are very much complimentary to each other in their distinct uses.
Thanks for the post. I’m starting a new business and we have been wondering how well our social media sites have been helping out. Twitalyzer looks like it will be able to really help us out.
No problem Industrial Coatings.
You must check out the handbook and their blog for the latest updates to the software.
Even five years later this post is valid, and in the internet world that is saying something. Thank you for the post it broke twitalyzer down nicely for me.