Content grouping in Google Analytics is a wonderful new feature which I have been playing around with for a few weeks now.
Basically, the content grouping feature allows you to group a set of URL’s or pages so that you can view aggregated data such as visits and conversions by category or by sections of your website.
For those who need an intro, here’s a video which explains what it is and how it works:
And here’s a great tutorial on how to set up content groups in Google Analytics.
How Could a Construction Products Business Use Content Grouping?
For this purpose I have made up an example company who manufacture and supply a range of timber, steel, plastic, aluminium and concrete products:
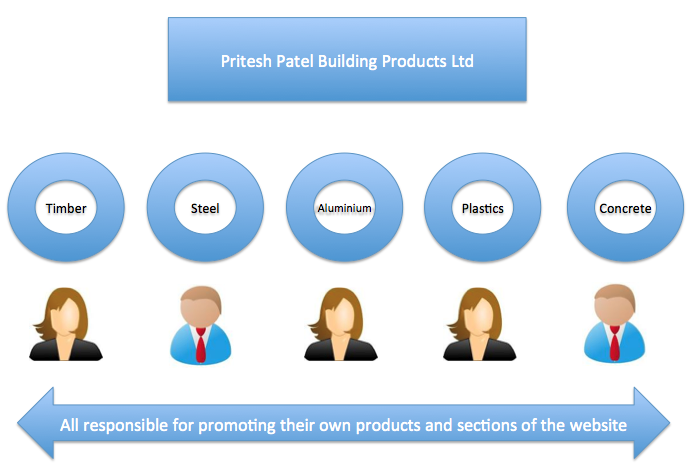
Each product category has it’s own product manager who is also responsible for managing their own campaigns and respective sections on the website.
And here’s how the website is structured:
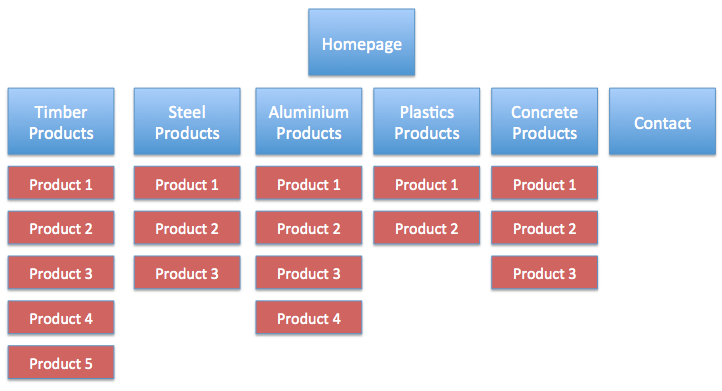
Remember, the categories could be anything but for this example I have chosen product types.
Which Product Materials Attract the Most Visits?
So what we want to know is how many visits each product group (all the products within the timber category and so on) has generated and enquiries or goals by product groups.
Once you’ve configured content groupings to aggregate visits by section/category or product range in Analytics you’ll have to wait a week or so for some meaningful data to start appearing. See above link for how to set up groups.
Then you have should have some data that looks like this…
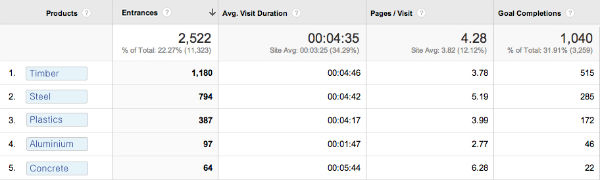
The above table is created using custom reports and shows the timber section of the website is most popular and converts the most traffic into enquiries, followed by steel products.
We could also add in a column to show conversions as percentages.
Now each of Product Manager can quickly see how many visits have entered the site through their own products – this data then can be segmented by source and then by campaign if more detail is required.
The data also shows that visitors who enter the site from the concrete range of products are the interacting/engaging with the content more so than the other product categories. They spend on average nearly 6 minutes on the site and view 6 pages.
It could be that the concrete range are complex products and require some in-depth technical reading before converting whereas timber products are less technical and have simpler conversion process.
The content grouping data can also be viewed on your Google Analytics dashboard by setting up the chart widget below:

This is a much quicker method of viewing the visits to the website for each product range/category.
Always be Comparing Over Time
As a business, each Product Manager will want to raise awareness of their own products by conducting a series of campaigns over time with some end goals. Website goals in analytics such as sample requests, downloads, CPD bookings, sign ups or registrations.
So, by analysing the same data over a period of time, you can see if there’s been any improvement in visits to the site for each product category.

The above data shows that the Timber category has seen a fall in traffic whilst Steel, Aluminium and Concrete have seen some growth. Is this due to a joint campaign or a longer term search and content strategy?
What are Mr Steel, Miss Aluminium and Mr Concrete doing better than they did before? Or is it a seasonal trend? Or what could Miss Timber and Miss Plastics learn from the others to grow traffic to their product ranges?
As with all data, it should help to answer some questions about the past or ask questions to improve the future.
Examples using Graham Plumbers Merchant and NBS
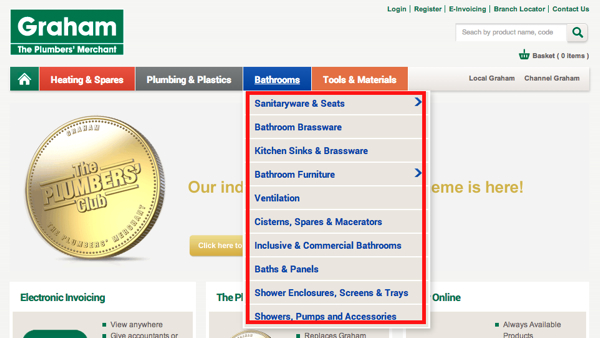
I can see content grouping working really well for merchants and distributors. Below is the website for Graham plumbers merchant. With their vast amount of products you could use content grouping to see which categories (heating & spares, plumbing and plastics, bathrooms and tools & materials) get the most visits and then also be product within categories.
Marketing offers and campaigns can be created to increase awareness or sales of specific items.
If you’ve got a content driven website then it could be useful to see which categories and topics attract the most visits. You could then try and promote other areas of the site from the pages or topics which are most popular or add some call to actions on the low converting groups.
NBS have a couple of things which could be grouped. The first is the main categories such as products, topic areas and NBS TV.
The second is the Topic Areas. It would be interesting to see which topics generate the most visits and if these correlate to external marketing campaigns or members needs.
So there you have it. Content grouping in Google Analytics at a glance.
Useful for Large Websites or Products Managed by Individual Managers
I think for those who manage large websites with lots of categories or products will find this latest addition very useful indeed. Even those whose websites reflect the way the business is also structured in that each category has its own set of product or marketing managers.
If you need help setting up content groups for your website or require any Analytics services then please do get in touch.
[button link=”http://priteshpatel.me/services/analytics/”]I’d like to know more about how Analytics can help me[/button]